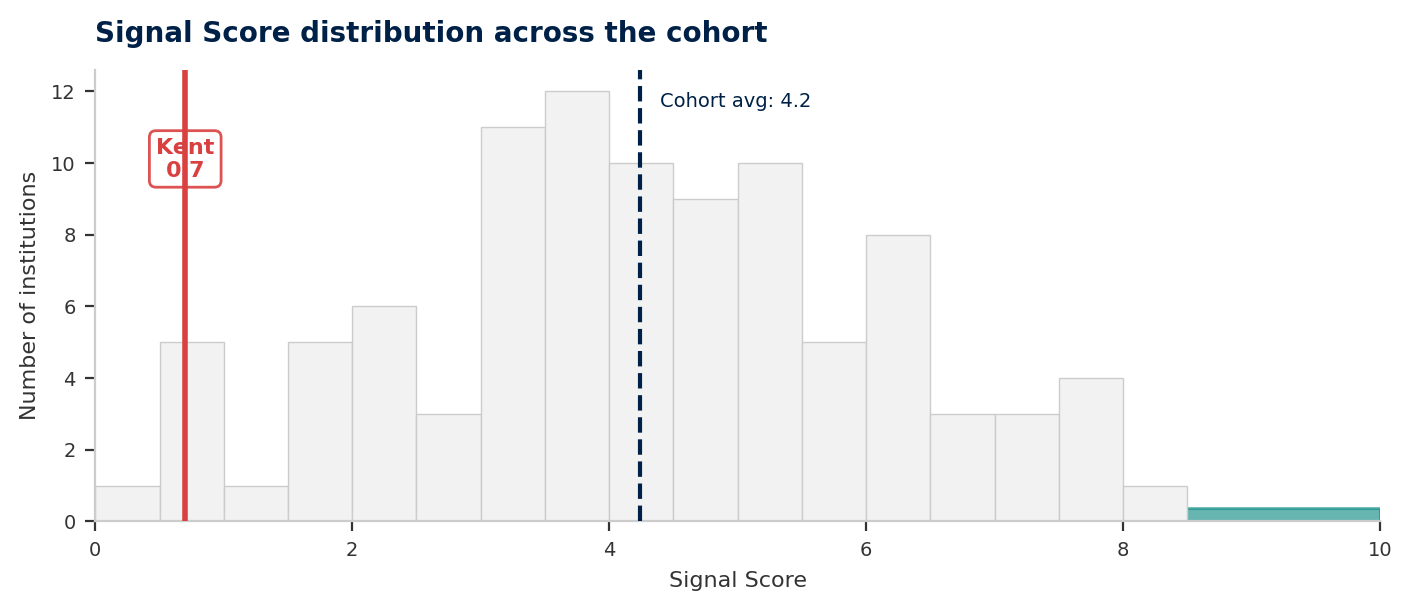
The Signal Score for Kent is 0.7 out of 10, placing the university in the bottom decile of 97 English higher education institutions. This is not driven by weakness in one area. All five dimensions of organisational culture score below 2.0, a pattern classified as Broad Cultural Strain.
The most important finding in this report is the gap between what Kent says it wants to be and what the data shows it is. The university's own strategy document names "Embrace Change" as a core institutional value. The data tells a different story: six consecutive years of falling enrolment, four years of underlying operating deficits, and an NSS Student Voice score that sits 7.7 points below benchmark.
The planned merger with the University of Greenwich, forming the London and South East Universities Group (LASEUG) from August 2026, is the strategic response to these pressures. Whether Kent's organisational culture can support a merger of this scale is the central question this report raises.
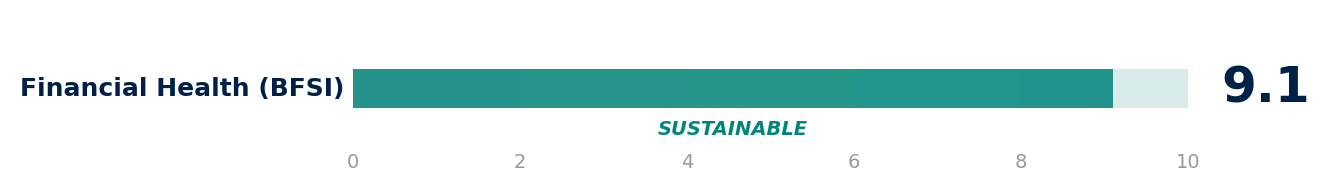
Financial reserves remain intact
BFSI score of 9.1 places Kent in the Sustainable band. Unrestricted reserves at 94.4% of income provide a buffer for the merger integration period.
Student retention above benchmark
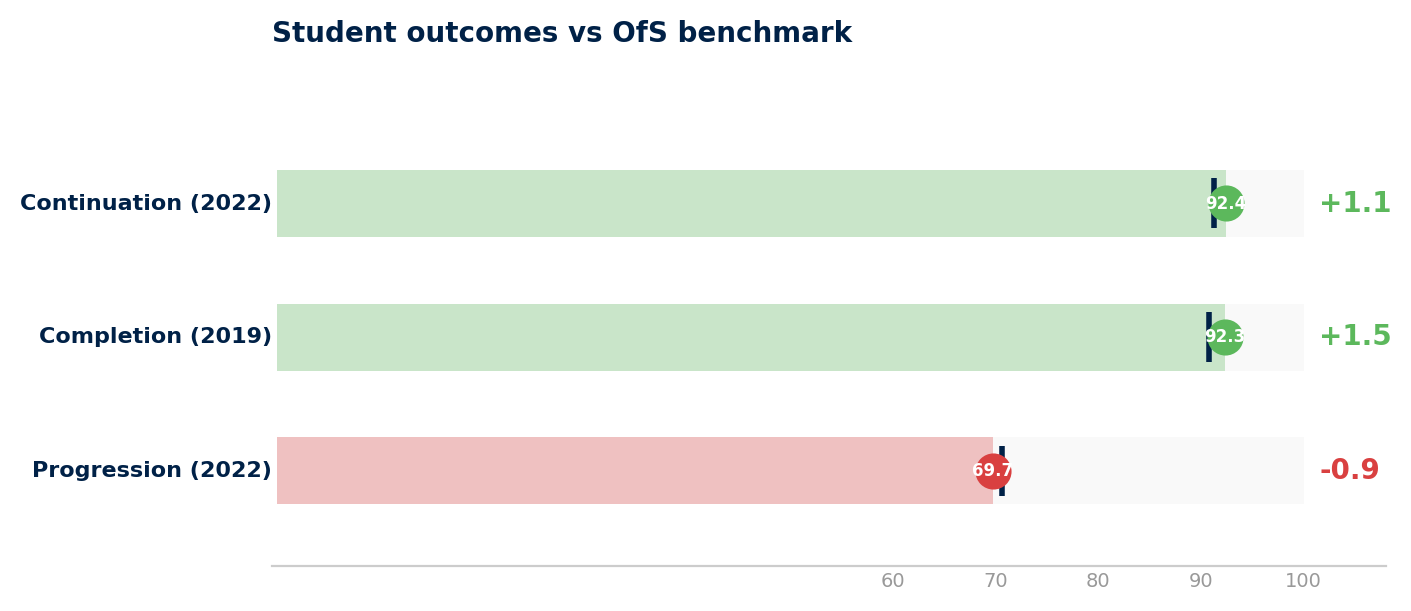
Continuation at 92.4% (benchmark 91.3%) and completion at 92.3% (benchmark 90.8%). Students who arrive at Kent tend to stay and finish their degrees.
Medical school demonstrates capability
The Kent and Medway Medical School, launched September 2020, is evidence that Kent can execute a complex, multi-partner strategic initiative.
Demand has collapsed across both markets
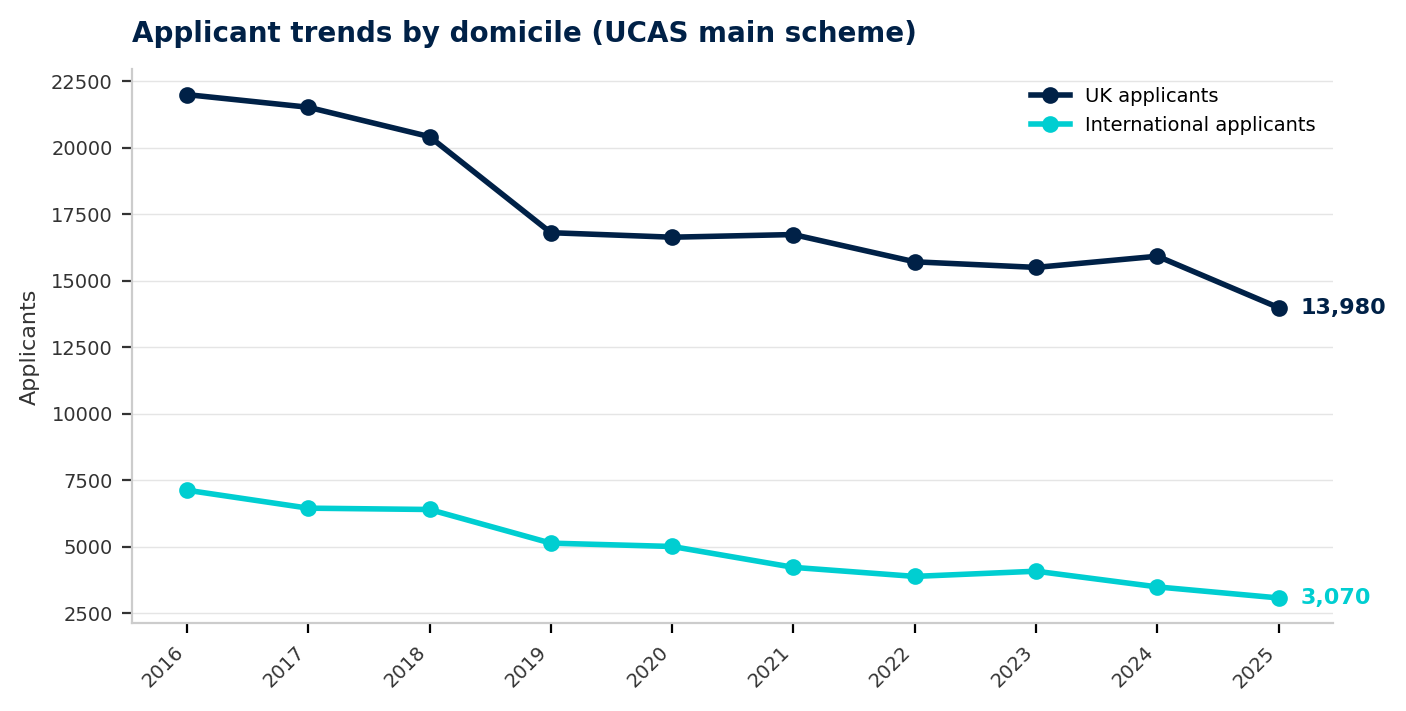
Total applicants down 41.5% since 2016. International applicants down 56.9%. UK applicants down 36.4%. This is structural contraction, not a cycle.
Sustained workforce restructuring
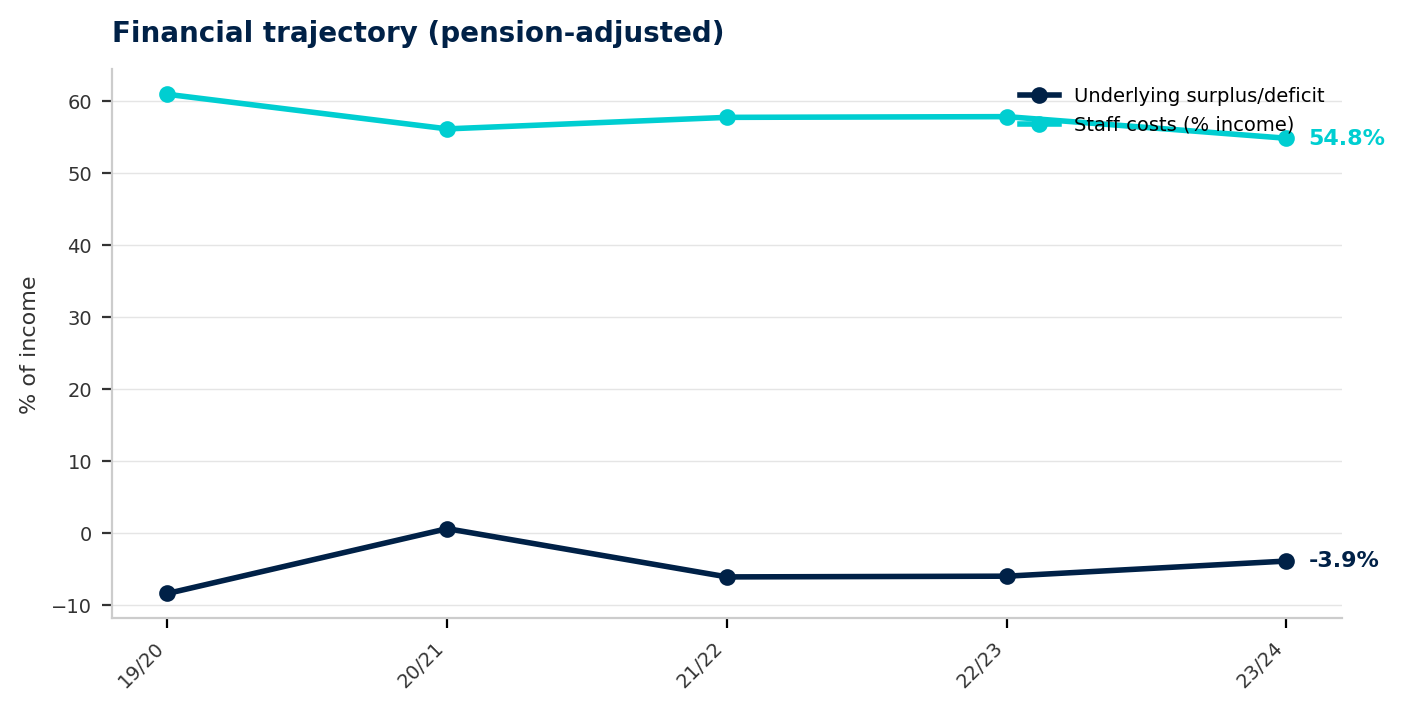
146 individuals received compensation for loss of office in 2023/24. Staff costs reduced from 60.9% to 54.8% of income over five years.
Students do not feel heard
NSS Student Voice score of 69.0% is 7.7 points below benchmark. Only 54% of students believe their feedback is acted on.
The Signal Score is calculated from 59 publicly available data points, drawn from six sources: HESA staff and finance data, UCAS application data, the National Student Survey, OfS student outcomes data, and institutional publications. These are mapped to five dimensions of organisational culture.
The Signal Score is not an opinion. It is a structured reading of what the public data says about how an institution is functioning. A low score does not mean an institution is failing. It means the data is showing patterns typically associated with organisational strain.
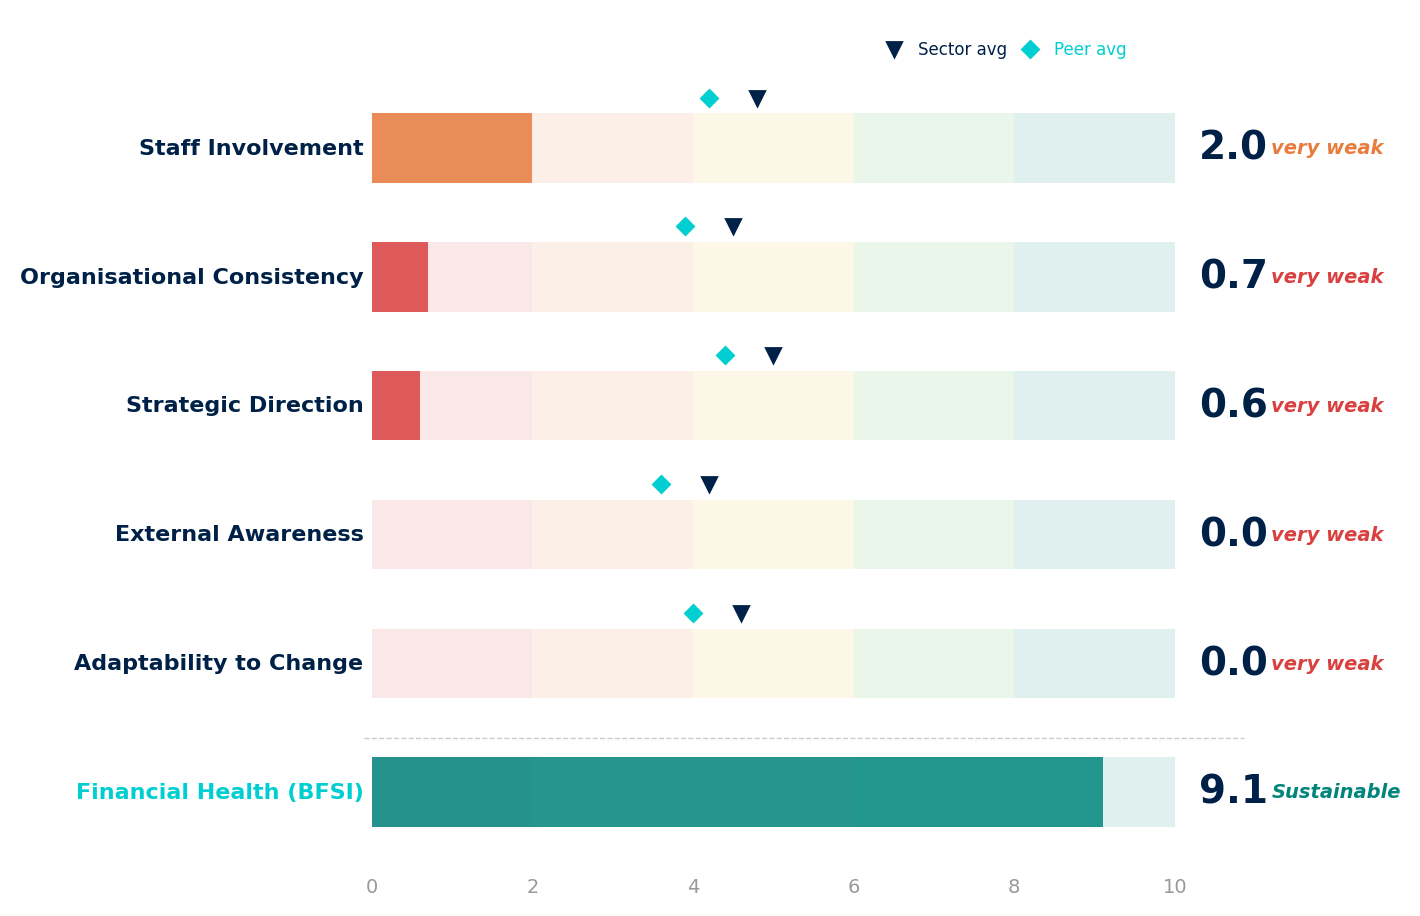
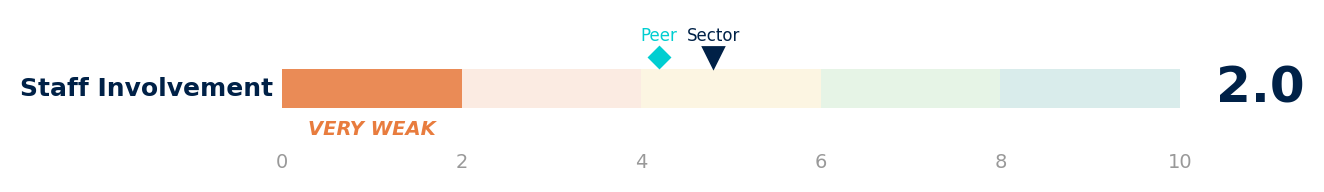
Staff Involvement
Kent's strongest dimension, though a score of 2.0 still places it well below the sector average. The workforce has been through a prolonged period of contraction that has brought costs closer to the sector average but at a human cost the data can detect but not fully measure.
In 2023/24, Kent reported 146 individuals receiving compensation for loss of office, at a total cost of £4.33 million. Staff costs stood at 54.8% of total income, down from 60.9% in 2019/20. The university now employs 105 professors across 10 academic schools.
The merger with Greenwich will require exactly the kind of workforce capacity and goodwill that sustained restructuring erodes. A workforce that has been through 146 severance payments in a single year is being asked to absorb the largest structural change in the institution's sixty-year history.
What is the cumulative effect of recent restructuring on staff capacity and morale, and what specific evidence exists that the workforce can absorb the integration programme?
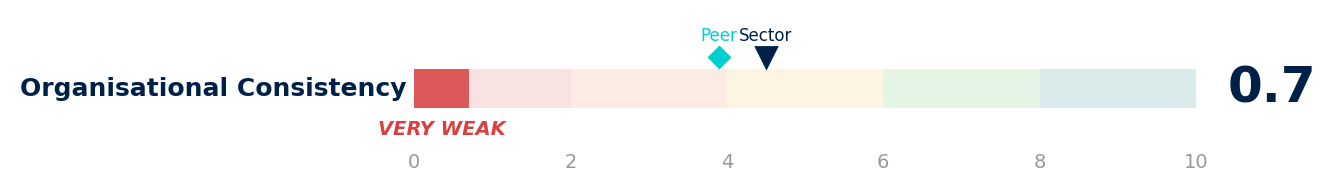
Organisational Consistency
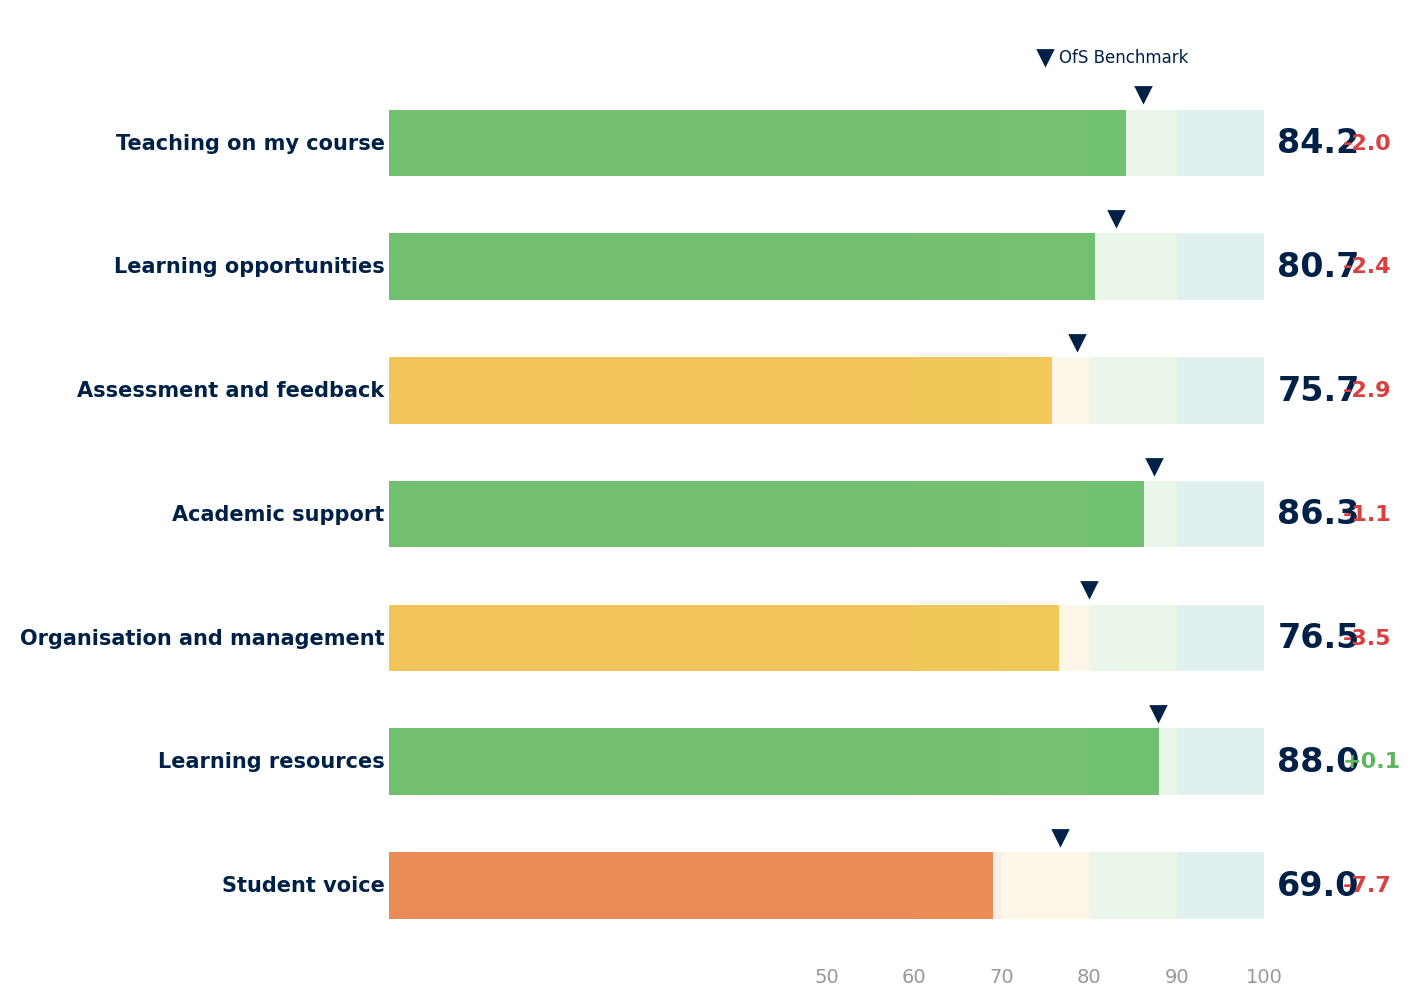
This dimension measures whether an institution's internal systems are pulling in the same direction. At Kent, they are not. The NSS results show the institution below benchmark on six of seven themes. The only exception is Learning Resources, where Kent scores 88.0% against an 87.9% benchmark.
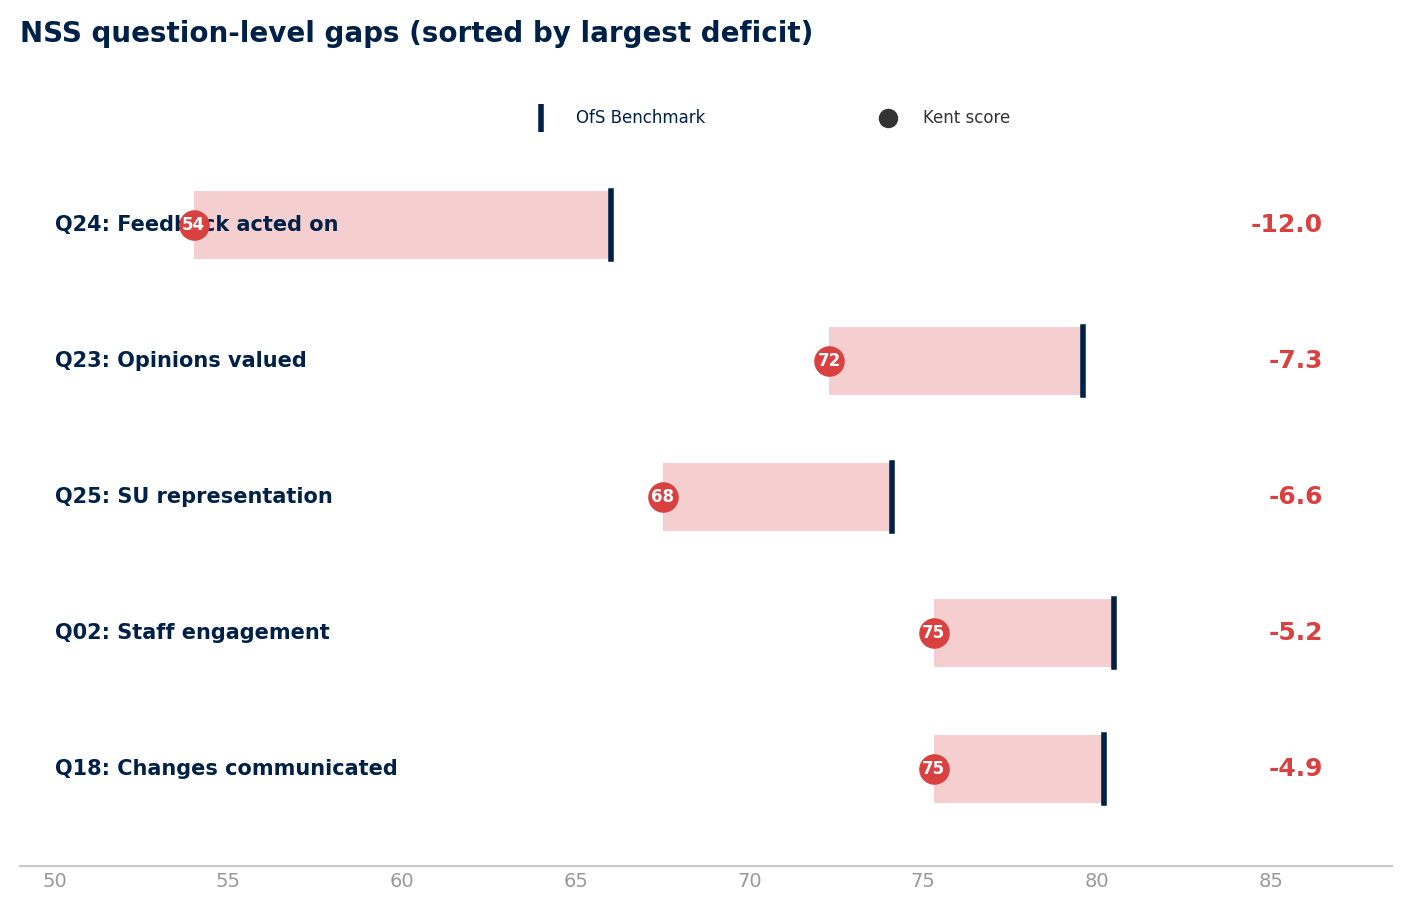
The weakness is sharpest on Student Voice. Kent scores 69.0%, against a benchmark of 76.7%. Within that theme, only 54.0% of students agree that their feedback has been acted on, compared to a benchmark of 66.0%. That is a 12.1 percentage point gap.
The gap between retention (a strength) and student voice (a weakness) tells a specific story. Kent can deliver a degree, but it struggles to make students feel that their experience is being actively shaped by their feedback.
Why does Kent score so poorly on student voice, and what mechanisms are in place to ensure students feel heard during the merger transition?
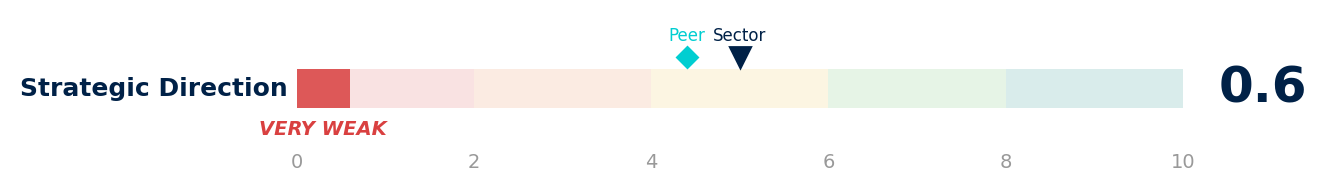
Strategic Direction
Total applicants have fallen from 29,110 in 2016 to 17,045 in 2025. That is a 41.5% decline over nine years. UK applicants down 36.4%. International applicants down 56.9%.
The most recent cycle saw the sharpest single-year decline in UK applicants: down 12.2% from 15,915 to 13,980. This is not the gentle drift of earlier years. It is an acceleration.
The merger with Greenwich is, in effect, the admission that Kent's standalone strategy has not worked. The institution has lost 41.5% of its applicants over nine years while operating under a strategy that named "Embrace Change" as a core value.
What is the demand forecast for the merged institution, and has the merger business case been stress-tested against a scenario where Kent's application decline continues or accelerates?
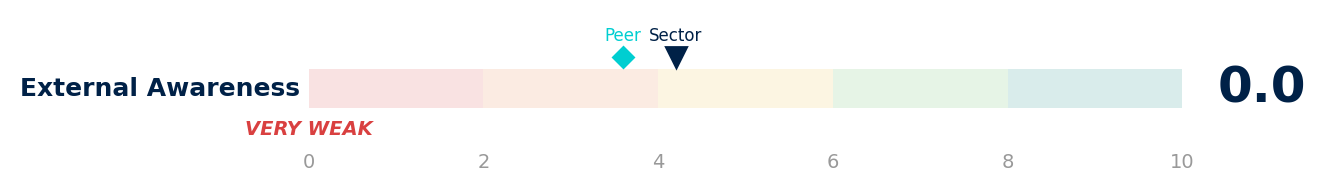
External Awareness
Graduate progression at 69.7% is marginally below the OfS benchmark of 70.6%. In a market where prospective students weigh graduate outcomes heavily, performing at benchmark is not a competitive advantage.
Kent's two largest subject areas — Social Sciences (7,535 enrolments) and Business and Management (7,215) — together account for roughly 30% of total enrolment. Both are declining. Both are subjects where London institutions hold a significant locational advantage, particularly for international students.
The acceptance rate in 2025 was 22.6%. This has been broadly stable, meaning the decline in acceptances tracks the decline in applications. Kent is not losing students at the offer stage. It is failing to attract sufficient interest in the first place.
What specific changes to programme design, pricing, or market positioning are planned for the merged institution, and how do they address the competitive dynamics that have driven Kent's decline?
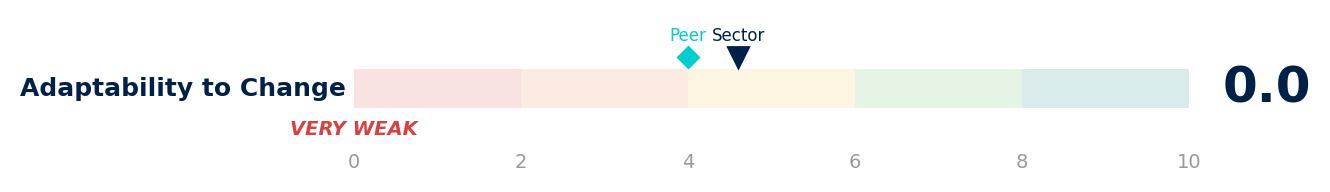
Adaptability to Change
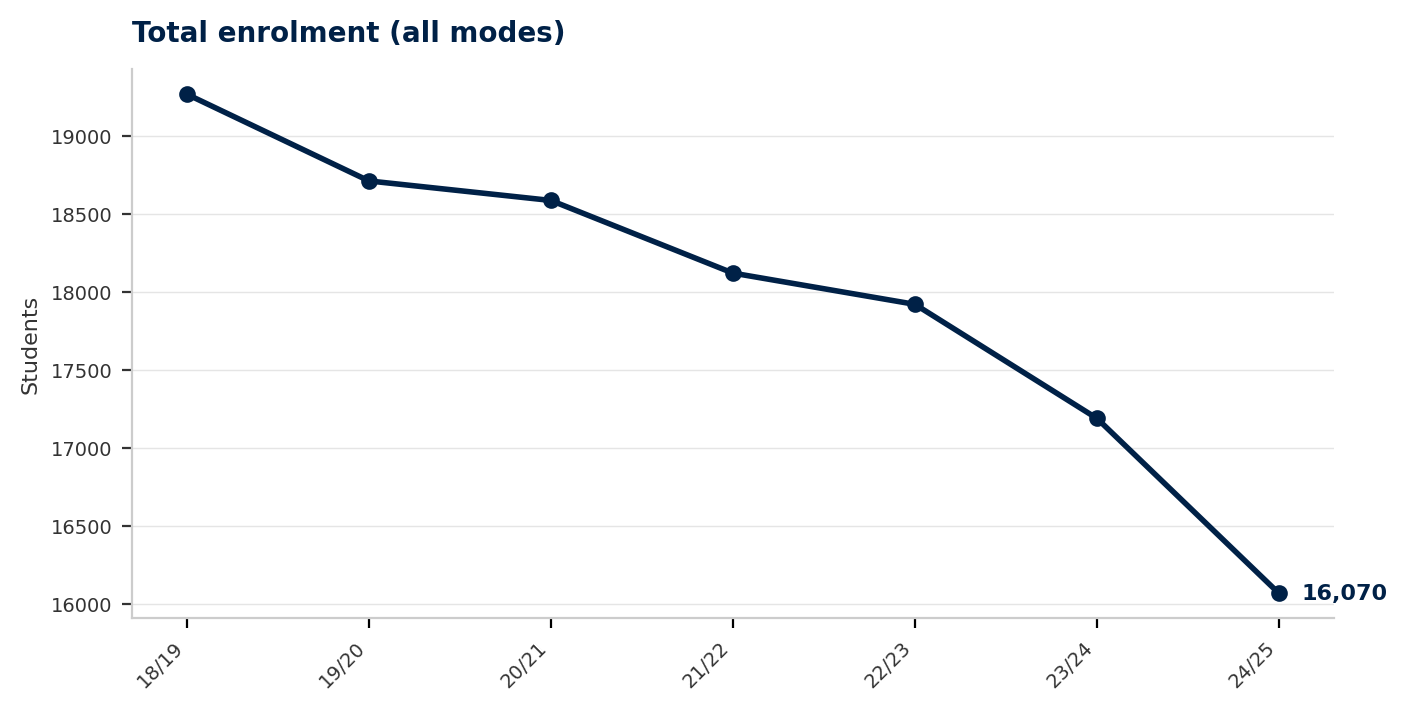
Kent's weakest dimension. Enrolment has declined in every year since 2018/19, falling from 19,265 to 16,070 in 2024/25. A cumulative loss of 3,195 students, equivalent to roughly £29 million in lost annual income.
The critical observation is not that enrolment has fallen. It is that enrolment has fallen in every single year for six consecutive years. There has been no stabilisation, no recovery year, no evidence that any intervention has changed the trajectory.
Kent's strategy listed "Embrace Change" as a core value and established six academic divisions to promote "agility and resilience." The structural reorganisation happened. The agility and resilience did not follow.
What specific evidence exists that the merged institution will be able to reverse the enrolment trajectory that Kent has been unable to address independently?
It starts with demand. Applications have fallen 41.5% over nine years. That decline has reduced income, which has forced cost reduction, which has led to sustained staff restructuring. A smaller, stretched workforce delivers a student experience that falls below benchmark. Students who do not feel heard tell the market. The market responds with fewer applications. And so the cycle continues.
The Signal Score of 0.7 is not driven by one bad year or one weak area. It is the cumulative reading of an institution where every signal is pointing in the same direction.
The merger with Greenwich is the intervention that breaks this cycle, or at least has the potential to. But mergers do not automatically resolve the organisational dynamics that created the problem. If the integration is not designed around an honest understanding of Kent's starting position, the cycle risks continuing inside a larger institution.
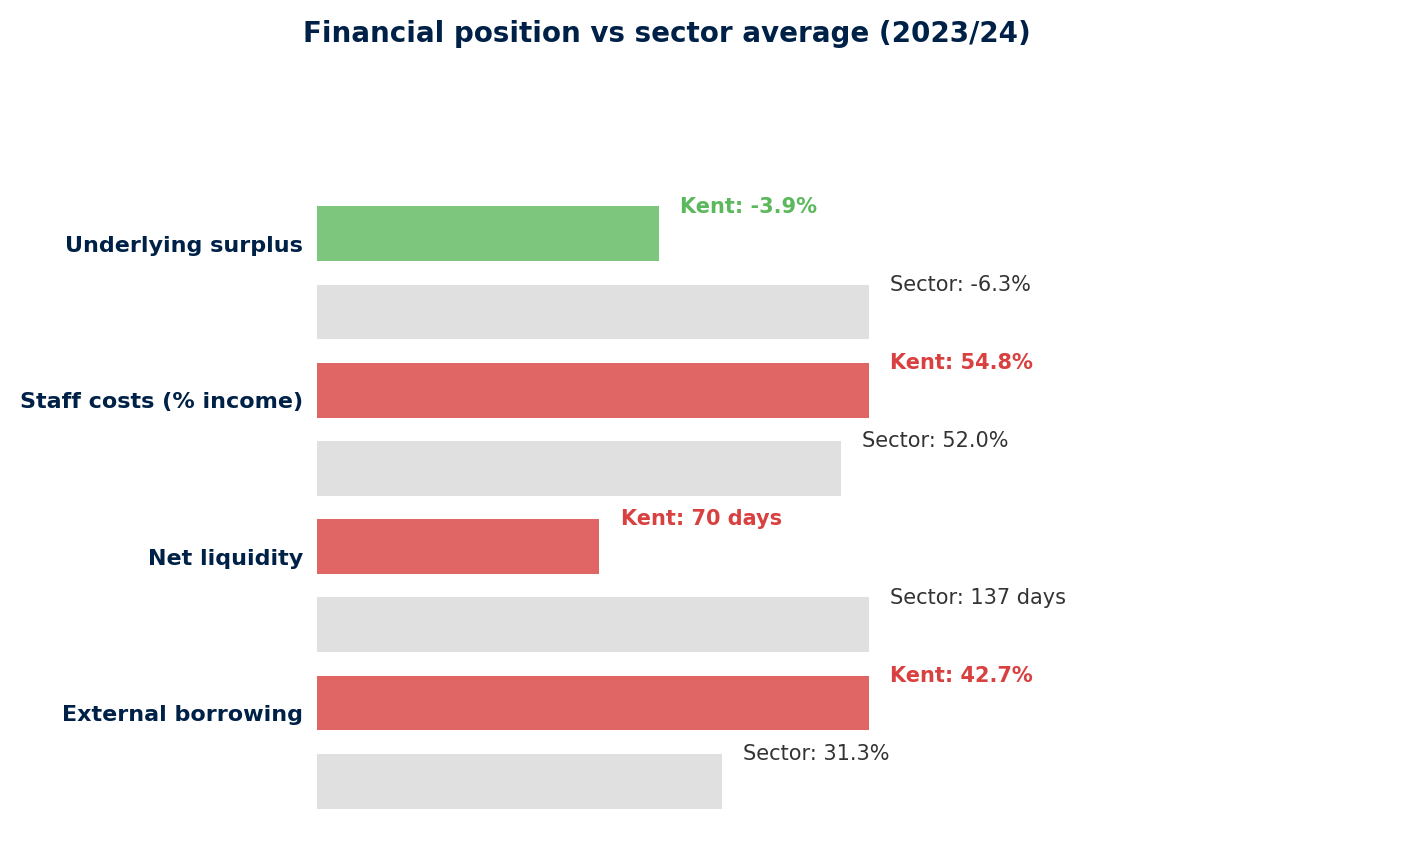
The headline BFSI score masks a more complex operating picture. Kent's reported surplus in 2023/24 was 21.1% of income. Strip out the pension adjustment, and the underlying result is a deficit of -3.9%. This is the fourth underlying deficit in five years.
Net liquidity days of 70 is half the sector average of 137. That is roughly ten weeks of operating cash — adequate for normal operations but leaves limited room for the unexpected costs that merger integration inevitably generates.
What is the financial model for LASEUG, and does it account for integration costs alongside Kent's ongoing structural deficit?
Over nine years, Kent has lost 12,065 applicants. The international decline pre-dates the most recent visa policy changes, suggesting it reflects a longer-term weakening of Kent's international competitive position.
Kent's enrolment is concentrated in subjects that face intense competition. Social Sciences and Business and Management together account for roughly 30% of total enrolment. Both declined between 2023/24 and 2024/25. These are subjects where London institutions hold a significant locational advantage.
What is the recruitment strategy for the merged institution? Has the business case been tested against continued decline?
The NSS data paints a consistent picture. Kent is not catastrophically bad on any theme. It is slightly below where it should be on almost everything, and significantly below on Student Voice — the theme that matters most during a period of change.
The outcomes data provides a more encouraging picture. Students who choose Kent tend to stay and graduate. This is a genuine strength the merged institution should protect.
What is the plan for student communication during the merger transition, and who is responsible for ensuring student voice is heard throughout the integration?
Kent's published strategy, "Kent 2025", set out a vision of becoming one of the best education and student experiences amongst UK universities. The data in this report does not support the claim that this was achieved.
The "Kent 2025" strategy has now expired. It has been superseded by the merger, which represents the de facto strategic direction. No public replacement strategy has been published.
In January 2026, Kent and Greenwich announced formal plans to merge as the London and South East Universities Group (LASEUG), with an effective date of 1 August 2026. The merged institution will combine Kent's approximately 16,070 students with Greenwich's approximately 29,695 students.
Kent enters the merger as the smaller partner. Its Signal Score of 0.7 compares to a cohort average of 4.2. The success of the merger will depend substantially on integration planning, cultural alignment, and the speed with which the merged institution can present a coherent identity to the market.
-
Merger readiness
The Signal Score of 0.7 places Kent in the bottom decile for organisational culture. What specific evidence exists that the institution's culture can support a merger of this scale?
-
Staff capacity
With 146 individuals receiving severance in 2023/24 and staff costs reduced by six percentage points over five years, what is the board's assessment of remaining workforce capacity and morale?
-
Student voice
Only 54% of students believe their feedback is acted on. What mechanisms are in place to ensure students feel heard during the merger transition?
-
Demand recovery
Total applicants have fallen 41.5% since 2016, with international applicants down 56.9%. What is the recruitment strategy for the merged institution?
-
Financial integration
The underlying operating deficit has persisted for four of five years. Net liquidity is half the sector average. What is the financial model for LASEUG?
-
Strategy
"Kent 2025" has expired and no replacement has been published. What is the strategic framework for LASEUG, and when will it be available for governance scrutiny?
-
Cultural alignment
Kent and Greenwich are different institutions with different cultures. What work has been done to assess cultural compatibility, and what risks have been identified?
-
Liquidity buffer
Net liquidity days of 70 are adequate for steady-state operations. Are they sufficient for merger integration costs, potential redundancy payments, and further enrolment decline?
The Signal Score
A proprietary composite index mapping 59 publicly available data points to five dimensions of organisational culture and health. Each dimension is scored 0-10 and benchmarked against a cohort of 97 English higher education institutions.
- Staff Involvement — workforce stability, cost structure, severance activity, contract types
- Organisational Consistency — student satisfaction alignment, outcomes consistency, governance indicators
- Strategic Direction — demand trends, financial trajectory, strategic investment evidence
- External Awareness — graduate outcomes, market responsiveness, competitive positioning
- Adaptability to Change — enrolment trends, response to external pressures, change capacity
Financial Sustainability Index (BFSI)
A six-factor composite drawn from HESA financial KPIs: surplus/deficit ratio, staff cost ratio, net liquidity days, external borrowing, net cash flow, and reserves position. Scored on a 0-10 scale.
Data sources
Over 80 million data points across 17 public datasets, maintained as longitudinal panel databases by Blairgowrie HE Intelligence. Sources include: HESA student, staff, and finance returns; UCAS application data; National Student Survey; OfS B3 student outcomes; OfS TEF indicators; LEO graduate earnings data; and institutional publications.
Confidence and limitations
Assessment date: 28 May 2026 | Data confidence: B (Indicative)
The Signal Score is an indicator, not a diagnosis. It identifies patterns in public data that warrant attention. It does not replace internal management information, staff surveys, or direct engagement with the institution.